Sales DNA Free for a limited time
See the prices where units moved.
Price history shows what a listing asked. Sales DNA shows the prices where stock actually left the shelf, laid against your own break-even and target.
Free for a limited time. Get it while it's free. Once it goes Premium, free users get a locked preview.


How it works
Three steps, from data you already have.
- Read every seller's stock record. Keepa keeps one for each seller on a listing, including sellers who have since left. Amazon's own offer counts as FBA.
- Turn each drop into units that moved. When a seller's stock falls between two of Keepa's readings, those units moved at that seller's price at that moment.
- Lay it on your zones. Each price gets the color of your zones: red below break-even, amber in between, green at or above your target.
Sales DNA uses the Keepa data Profit Zones already loaded for the chart. It spends no extra tokens.
What you see
A field of prices, one column per day.
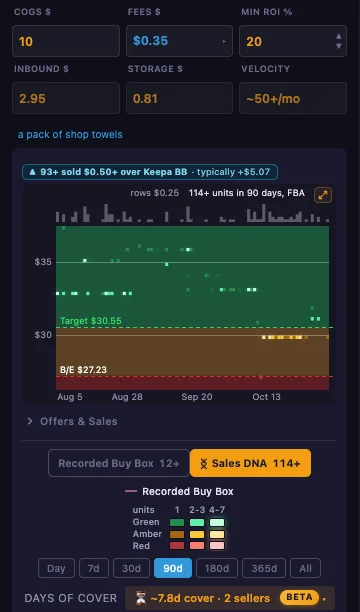
Switch the chart from Recorded Buy Box to Sales DNA. Price runs up the side, days run across, and each lit cell is a price where units moved, deeper in color where more moved.
Hover any cell
See how many units moved at that price that day, written as a floor (5+), which sellers moved them, FBA or FBM, and Keepa's Buy Box that day.
Open the expanded view
A headline count for the range, the split across your three zones, a price ladder, a 90-day strip, and every seller, live or gone.
Sold over Keepa's Buy Box
A chip above the chart counts units that moved over Keepa's recorded Buy Box (by $0.25 or 5% by default), so you can see real pricing headroom.
Your choice of sellers
Count FBA sellers (the default), FBM sellers, or both. The field follows the chart's range and zoom.
An example
A Hot Wheels car.
Keepa's Buy Box looked steady. The sellers' stock records showed more: over 90 days, 24 FBA sellers moved 242+ units at 36 different prices, from $14.44 to $17.97. Nineteen of those sellers had already left the listing.
With an example break-even of $15.00 and a target of $16.00, the field shows at a glance how much moved in each of your zones. A view of live sellers alone would have missed most of it.
Its limits
Every count is a floor.
Sales DNA is an estimate. It never guesses upward, so every count carries a plus: 59+ means at least 59.
- Keepa reads stock at intervals. A sale followed by a restock before the next reading doesn't show.
- Sales before Keepa's first reading of a seller aren't counted.
- A seller Keepa reads rarely can sit far below the truth.
- FBM stock is a number the seller types in, so it's weaker evidence.
Treat it as evidence to investigate, for example with a test buy priced where units moved. You make the call.
With Premium
Your own sales, and a whole list.
Premium Add your seller ID and your own sales are called out on the field, with your row in the sellers list. In the Bulk Analyzer, every card can show its Sales DNA field, and you can filter, sort and export by it.
Free for a limited time. Get it while it's free.
Add Profit Zones, open a listing, and switch the chart to Sales DNA.