Profit Zones · profitzones.app/research/sales-dna
Research · Sales DNA Free for a limited time
Sales DNA: what moved, at what price
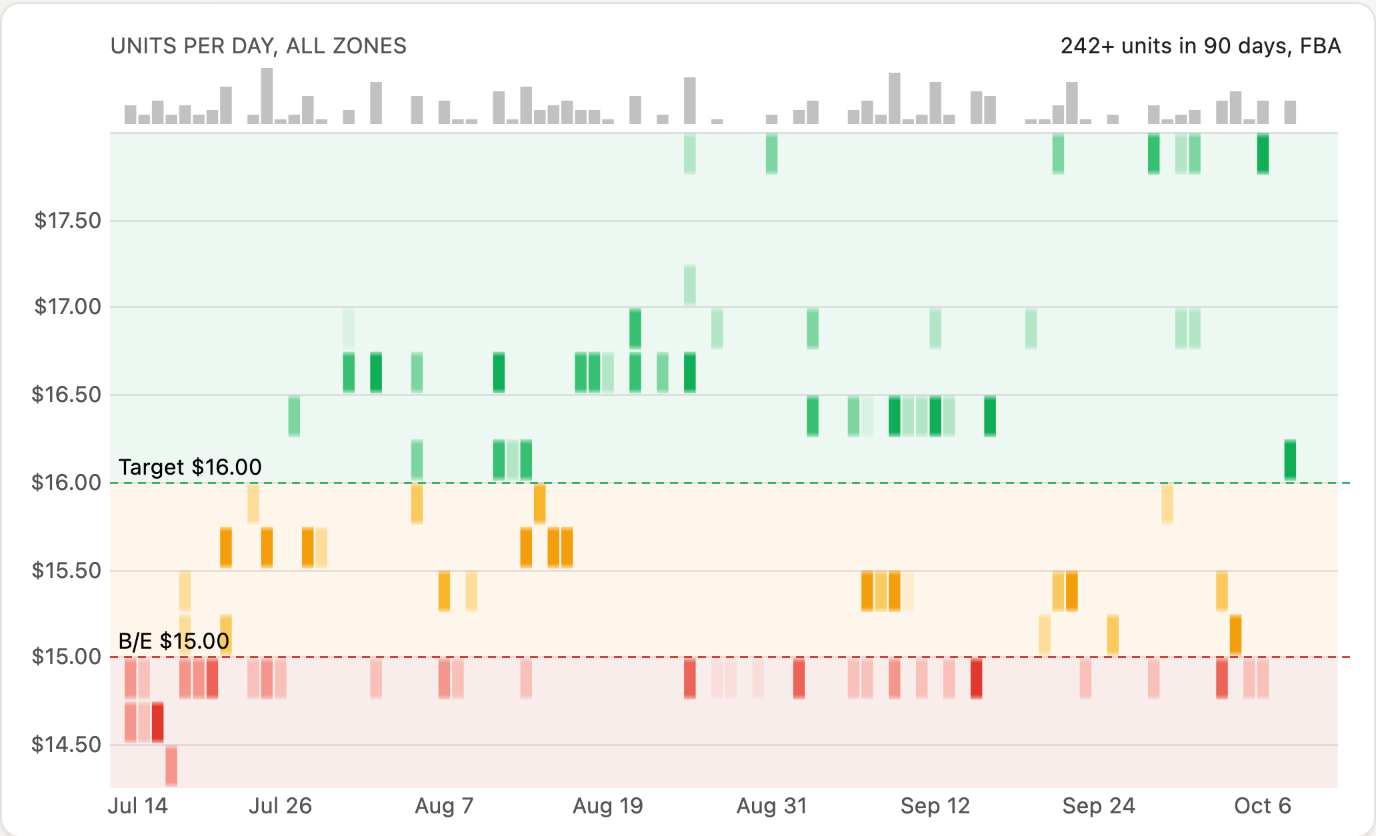
Profit Zones reads every seller's stock record in Keepa, live and departed, prices every reduction at what that seller charged at that moment, and lays it out as a field: price up through your zones, days across, each cell glowing by the units inferred moved there.
Free for a limited time. Get it while it's free. Sales DNA is part of Premium, and this is the Premium edition of the paper. Right now every Profit Zones user gets it on every listing. Once it goes Premium, free users get a locked preview.
The question every reseller asks
Is there evidence that I could make a profit on this listing? Keepa's chart draws one recorded Buy Box and the lowest prices. It does not say which offers moved units, or at what price.
Keepa does keep the evidence: a stock record and a price record for every seller it has tracked on the listing, including sellers who have since left. Nobody reads those records by hand.
Sales DNA reads them. Profit Zones turns each seller's inventory reductions into units moved, prices every reduction at what that seller charged at that moment, and lays the result against your own break-even and target. One switch on the chart, a field of what moved and where, a ladder of units by price, sales ticks and gap stems on the classic chart, a velocity source for your 3-Step check, and a flag in Bulk so these listings surface from a list of hundreds. It uses data you already get from Keepa, with no extra tokens.
Sales DNA is part of Profit Zones Premium, along with the pieces it shows, like Days of Cover. Every number is inferred from inventory reductions: evidence, not proof of sales.
Your choice of sellers
| Sellers counted | Setting |
|---|---|
| FBA sellers only | Default |
| FBM sellers only | Option |
| Both together | Option |
FBA is the default because Amazon counts FBA inventory. FBM inventory is a number the seller types: Amazon lowers it on a sale, but the seller can reset it by hand at any time, and some top it back up constantly. FBM reductions are weaker evidence. Every number in this paper is the FBA view unless it says "every seller."
The moment
You have a Hot Wheels car in your hand, Keepa's Buy Box looks steady, and you want to know if there is room for one more seller at a price that pays you. Here is what its sellers' stock records say about the last 90 days.
- 19 of 24
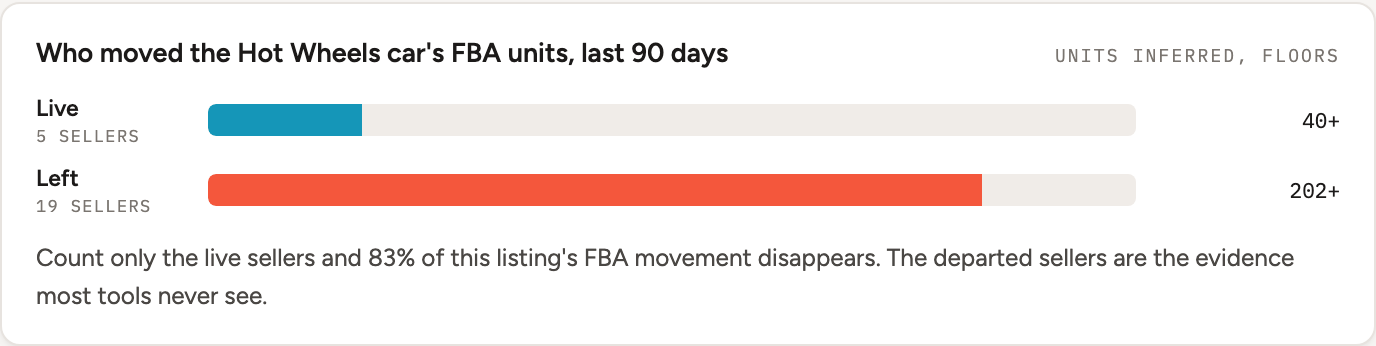
- FBA sellers on the Hot Wheels car in the last 90 days had already left. They carry 202+ of the 242+ FBA units. A live-only view misses them.
- 97+ of 242+
- FBA units moved while Keepa's recorded Buy Box sat at exactly their price, to the penny. The other 145+ moved while it showed a different price.
- 63 of 90
- days had an FBA inventory reduction, at 36 different prices from $14.44 to $17.97. The evidence is steady, not a one-time spike.
What Keepa already calls a sale
Open a listing in Keepa and go to Data, then Offers. Next to each offer's Stock History sit two columns, Sold and Sold 30 days, and a total row closes the table. Keepa watches an offer's stock step down and counts the steps as sold.
"Sold estimates are solely based on changing stock. The stock can not be accurately determined if per-customer limitations are in place. Not all stock changes are recorded."
Keepa, Sold column tooltip
So the bridge this paper is about, from stock changes to sales, is one Keepa already crosses. Its own tooltip says how far to trust it: an estimate, from changing stock, with gaps.
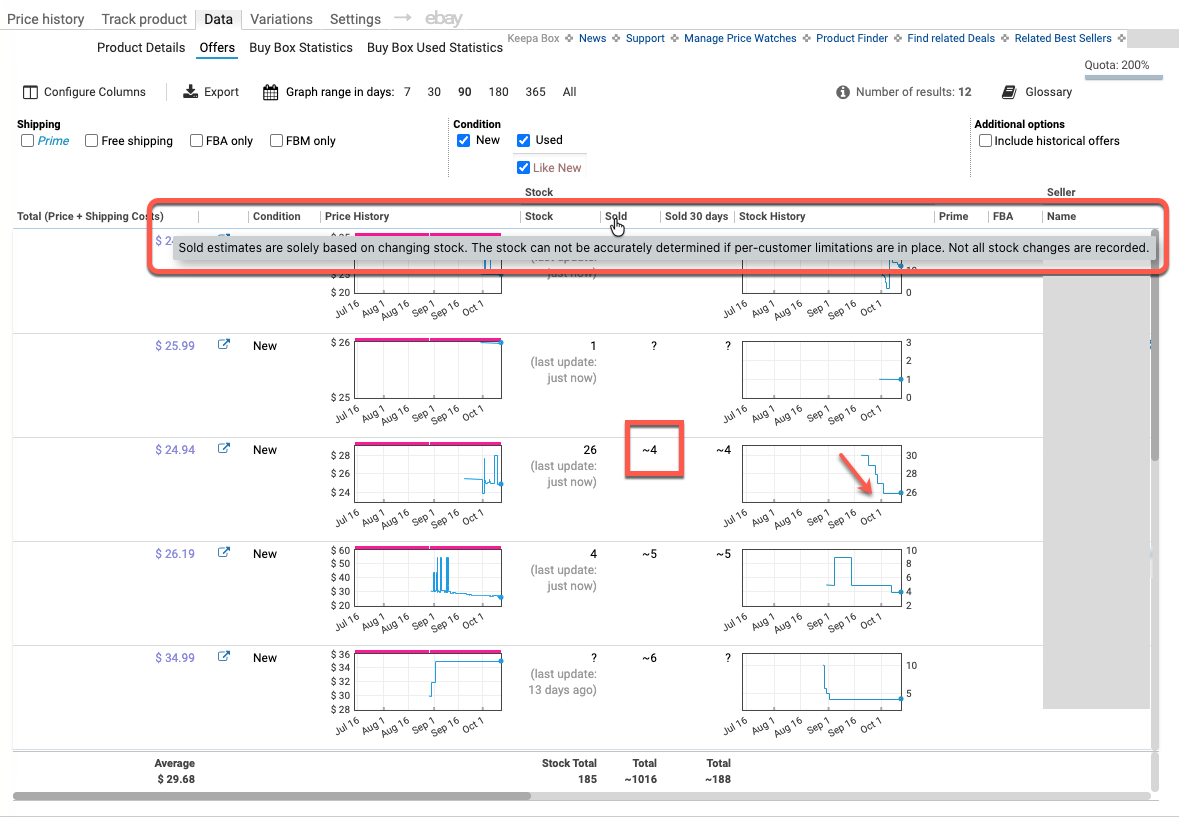
Same bridge, carried further. Keepa estimates Sold for each offer from its stock changes. Sales DNA reads the same records, which this paper calls stock records, for every seller, live and departed. It prices each reduction at what that seller charged at that moment and lays the result against your zones. Like Keepa's tooltip, Profit Zones treats it as an estimate from changing stock: it says moved, says inferred, and counts every number as a floor, N+.
The shapes Keepa reads as Sold
Real offers from Keepa's Offers table, sellers blurred, arrows ours. The clearest signal is the organic stair-step: stock stepping down a few units at a time.

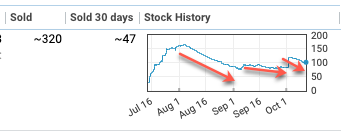
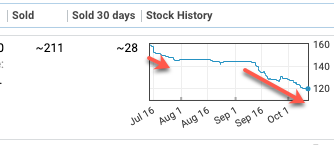
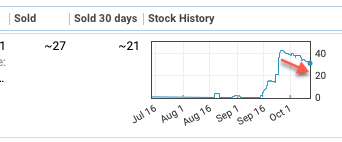
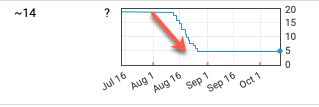
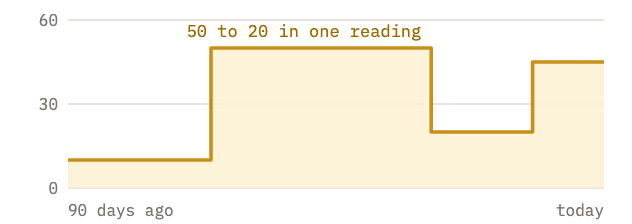
Why FBA is the default. The stair-step is clearest on FBA. Amazon counts FBA stock, so an FBA stair-step is the strongest evidence. An FBM seller can type a stock number at any time. Profit Zones reads FBM only when you choose FBM or Both (your choice of sellers), and a one-time cliff stays out of the floor (the method).
Why DNA: a field that reads like a gel
The name comes from the picture. Put every inferred unit on a grid, price up and days across, and let each cell glow by how many units moved there. Busy prices form bright bands; quiet ones fade. It looks like a DNA gel, and like a gel it is a fingerprint: every listing's bands sit in their own places.
Take a Hot Wheels car. Amazon's badge says 100+ bought in past month. Keepa's chart shows one recorded Buy Box price at a time. The sellers' logs show more: 24 FBA sellers moved 242+ units in 90 days at 36 different prices, from $14.44 to $17.97, and 19 of those sellers have since left.
- 251+ every seller
- 27 sellers with a readable stock record, 21 of them since gone. FBM adds 9+ from 3 sellers. 90 days to Oct 11.
- 242+ FBA sellers
- 24 FBA sellers, 19 since gone. The departed sellers carried 202+ of it; the live ones 40+.
- 97+ at the recorded Buy Box
- FBA units that moved while Keepa's recorded Buy Box sat at exactly their price. The other 145+ moved while it showed a different one.
Evidence, not proof. An inventory reduction is circumstantial evidence of a sale, and circumstantial is the right word. Evidence gets investigated before anyone acts on it. Profit Zones gathers it, reads it for every seller including the ones who have left, and leaves the call to you: a test buy, priced where the evidence says units moved.
The badge is Amazon's count: rounded, for a month, across every seller. The logs give a floor, seller by seller and price by price, and they reach back as far as Keepa has read the sellers: 532+ FBA units in 180 days, and 1,155+ since Keepa's first seller inventory reading on this listing, Feb 6, 2023.
That is what this feature does, on every listing you open. Not a verdict. Not a label. Evidence of sales at a price, read against your own numbers.
The recorded Buy Box, in the rear-view mirror
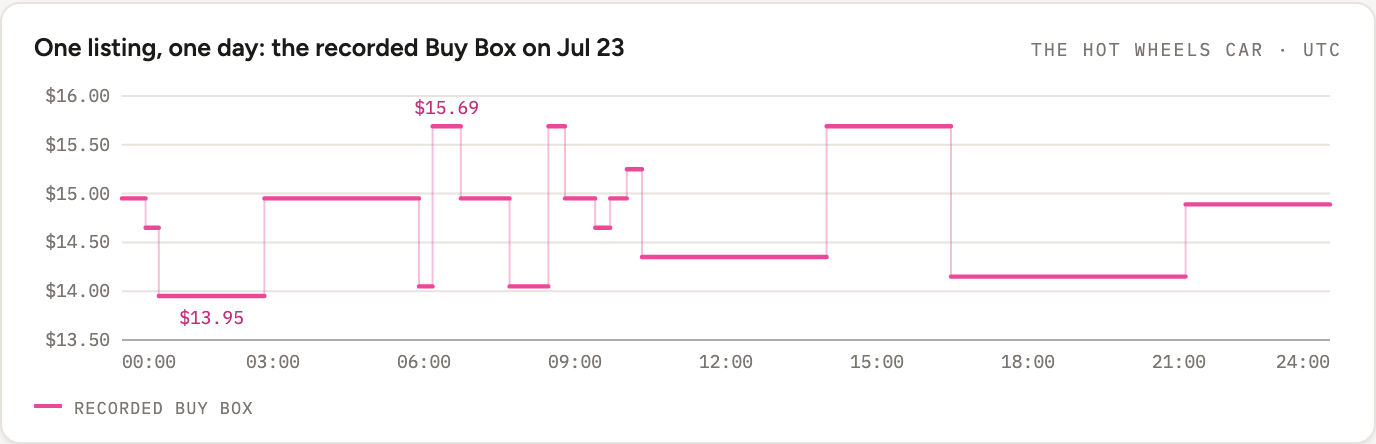
Keepa watches from one spot. Our Buy Box by Metro research puts that spot on the East Coast: a fine answer in Newark, a partial one in Phoenix. There may not be a single Buy Box at all. When inventory is saturated across the delivery network, every shopper often sees the same winner. When it is not, Amazon picks a winner per shopper, and where the shopper lives is part of it. In Profit Zones, Buy Box by Metro reads up to 18 markets and shows the difference.
So this paper says recorded Buy Box. Just because a temperature was recorded on a day in 1923 does not mean it was the only temperature that day. The recorded Buy Box is one reading, from one place. The evidence of sales is every seller's stock record. The chart's switch keeps both, one at a time: Recorded Buy Box, the legacy view, and Sales DNA, the field.
The words this paper uses
- Inventory reduction
- A fall in a seller's inventory between two Keepa readings. Not a "drop": that word already means something else in Keepa.
- Moved, inferred
- Units that left a seller's inventory as Keepa recorded it. Most are sales. Some are removals or corrections, so Profit Zones says moved and says inferred.
- N+
- Every count is a floor: 242+ means at least 242. A departed seller's final big fall, or any seller's one-time cliff, is left out of the floor.
- Recorded Buy Box
- Keepa's Buy Box, as seen from its one vantage point. Its chip on the chart switch counts the units that moved while it sat at exactly their price.
- Your zones
- Your break-even and your target, from your cost and the fees Profit Zones already computes. Red under break-even, amber between, green at or over target.
- Your sellers
- FBA, FBM, or both. FBA is the default: Amazon counts it. FBM is a number the seller types and can reset by hand.
What Keepa keeps that its chart doesn't show
Every offer Keepa has seen on a listing carries two logs: its price over time and its inventory over time. Keepa keeps both after the seller leaves. The chart draws neither seller by seller, and an offers list shows only who is listed today. Keepa's seller inventory history on this listing starts Feb 6, 2023.
On the Hot Wheels car, 24 FBA sellers carried a readable stock record in the 90 days to Oct 11. Of those, 5 were still listed. The other 19 had run out or left, and Profit Zones infers they moved 202+ of the 242+ FBA units.
Two chips, your range, your sellers
Each chip carries its count and follows the range buttons, so the Sales DNA chip always matches the field you're looking at.
| Range | Sales DNA | Recorded Buy Box |
|---|---|---|
| 7 days | 11+ | 6+ |
| 30 days | 75+ | 24+ |
| 90 days | 242+ | 97+ |
| 180 days | 532+ | 225+ |
| 365 days | 754+ | 310+ |
| All (1,344 days) | 1,155+ | 536+ |
The Hot Wheels car, FBA view. Each range counts whole days, the field's own grid.
Who carried it, one click in
A collapsed list: a short seller ID, FBA or FBM, live or left, and the units each one moved. The store name appears when Profit Zones already knows it. Profit Zones never looks up a departed seller's name.
Put your own seller ID in Settings and your row rides first whenever your offer falls in the range you're viewing. If it sits outside the range, one line says so, for example: "You: last seen Jun 26, 1+ inferred. Switch to 180d to include it."
The headline never depends on how many sellers carried the units. One seller or ten, the evidence is the evidence.
How Profit Zones reads it, in three steps
- Every seller, live and departed. Every New offer with a readable stock record, in the channel you chose, Amazon's included as FBA. A reading of 1,000+ (999 for Amazon) is a cart probe, and a purchase-limit bounce can't be read. When Amazon's is capped, its sales are placed at its price from sales rank while it held Keepa's recorded Buy Box.
- Inventory reductions become units moved. A fall in inventory is units moved. A rise is a restock and is ignored. A one-unit dip that reverses within two days is a wobble and is filtered out. A big one-time fall on any seller, and a departed seller's final fall, could be units moving or a removal, so they are left out of the floor.
- Each reduction gets its own price. Every reduction is priced at what that seller charged at that moment. A repricer that swings between two prices during the day is counted at the price its units moved at. The result is the field and its ladder: units moved at each price, laid against your zones.
Worked example: one FBA seller, 10 days, 8 units at $16.49
The Hot Wheels car, Sep 3 to Sep 12. One FBA seller, Seller A, since gone: Keepa last saw it Sep 17. This seller held one price, $16.49, while its inventory stepped down 5 times. Keepa's recorded Buy Box sat lower at every one of those readings, $14.98 to $15.37, so each unit moved $1.12 to $1.51 over it (7% to 10%). Reading by reading:
| Keepa reading (UTC) | Inventory | Change | Seller's price | Recorded Buy Box | What Profit Zones counts |
|---|---|---|---|---|---|
| Aug 31, 23:59 | 6 | $16.49 | $15.39 | Starting level | |
| Sep 3, 15:36 | 3 | −3 | $16.49 | $14.99 | 3 moved at $16.49 |
| Sep 6, 22:53 | 1 | −2 | $16.49 | $15.26 | 2 moved at $16.49 |
| Sep 9, 00:10 | 2 | +1 | $16.49 | $16.49 | Restock, ignored |
| Sep 9, 10:00 | 4 | +2 | $16.49 | $15.25 | Restock, ignored |
| Sep 10, 03:07 | 3 | −1 | $16.49 | $15.37 | 1 moved at $16.49 |
| Sep 11, 13:27 | 2 | −1 | $16.49 | $14.98 | 1 moved at $16.49 |
| Sep 12, 09:50 | 1 | −1 | $16.49 | $14.99 | 1 moved at $16.49 |
| Sep 3 to Sep 12 | −8 | $16.49 | $14.98 to $15.37 | 8 moved at $16.49, inferred |
Why the floor. Keepa reads inventory at intervals, so a reduction between two readings is the most Profit Zones can know. Restocks, wobbles and one-time cliffs are taken out, and what is left is a number Profit Zones will stand behind: 242+ means at least 242. Across the 90 days, these 8 units are part of the 22+ FBA units that moved at $16.49. None of those moved while the recorded Buy Box sat at exactly $16.49, so they count in Sales DNA and not on the Recorded Buy Box chip.
Reading the field
The chart area has one switch: Recorded Buy Box or Sales DNA, one view at a time, each chip carrying its count. Here is the Hot Wheels car on Oct 11, in the FBA view over 90 days, at an example cost with break-even $15.00 and target $16.00.
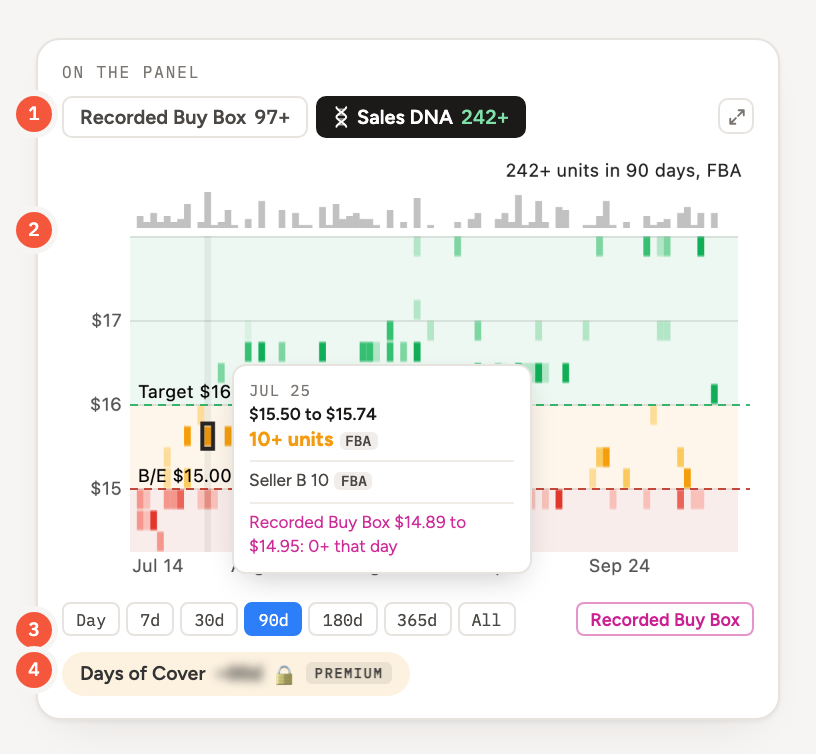
- The switch and its counts. The Sales DNA chip leads with a small double-helix mark. Recorded Buy Box 97+ counts units inferred moved while Keepa's recorded Buy Box sat at exactly their price, to the penny. In that view, hover the recorded Buy Box line: "Sold at this Buy Box price: N+ units" for that price's stretch.
- The field. Price up through your zones, days across. Each cell heats inside its zone's hue by the units that moved there that day (Zone Heat, on the classic chart); bars on top are units per day. Hover a cell for its day, price, units, FBA or FBM, top sellers, and what moved at the recorded Buy Box that day.
- Range, and the recorded line. The field follows the chart's range: Day, 7d, 30d, 90d, 180d, 365d or All. At 180 days this listing reads 532+, 225+ of it at the recorded Buy Box. The pink chip, off here, draws Keepa's recorded Buy Box over the field.
- Days of Cover. The pill sits under the range row, here and in both expanded views. It is part of Premium, like the rest of Sales DNA: it opens Seller Intel on top.
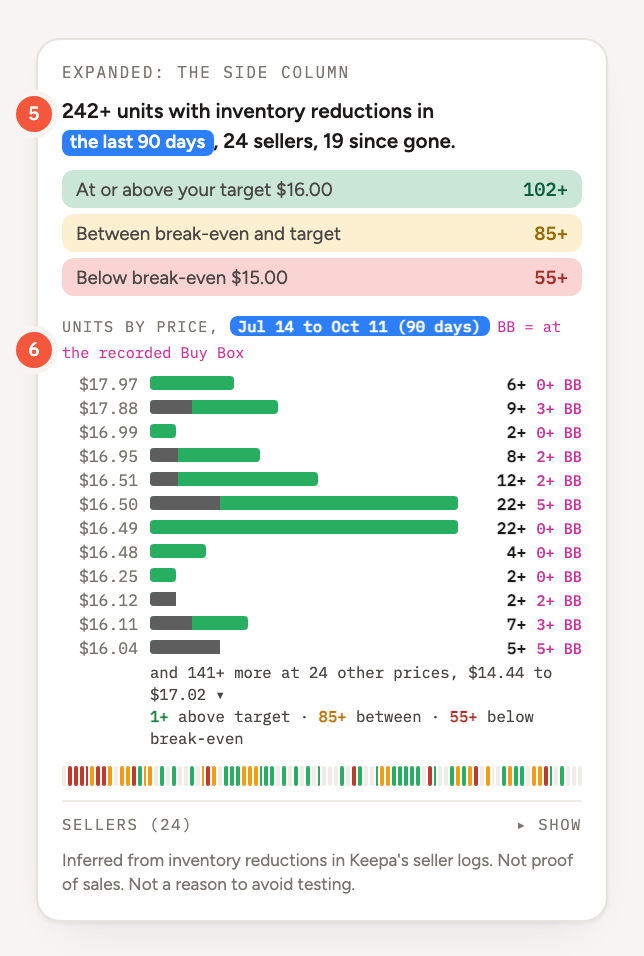
- Your zones. Expand the field for the side column. The same units, sorted by your own prices. Here 102+ moved at or over $16.00, 85+ between, 55+ under $15.00.
- The ladder. Twelve prices, green first, then amber, then red; the rest fold into one row. "N BB" is the units that moved while the recorded Buy Box sat at that rung's price, the gray left part of its bar.
Show sales, and what sold over Keepa's Buy Box
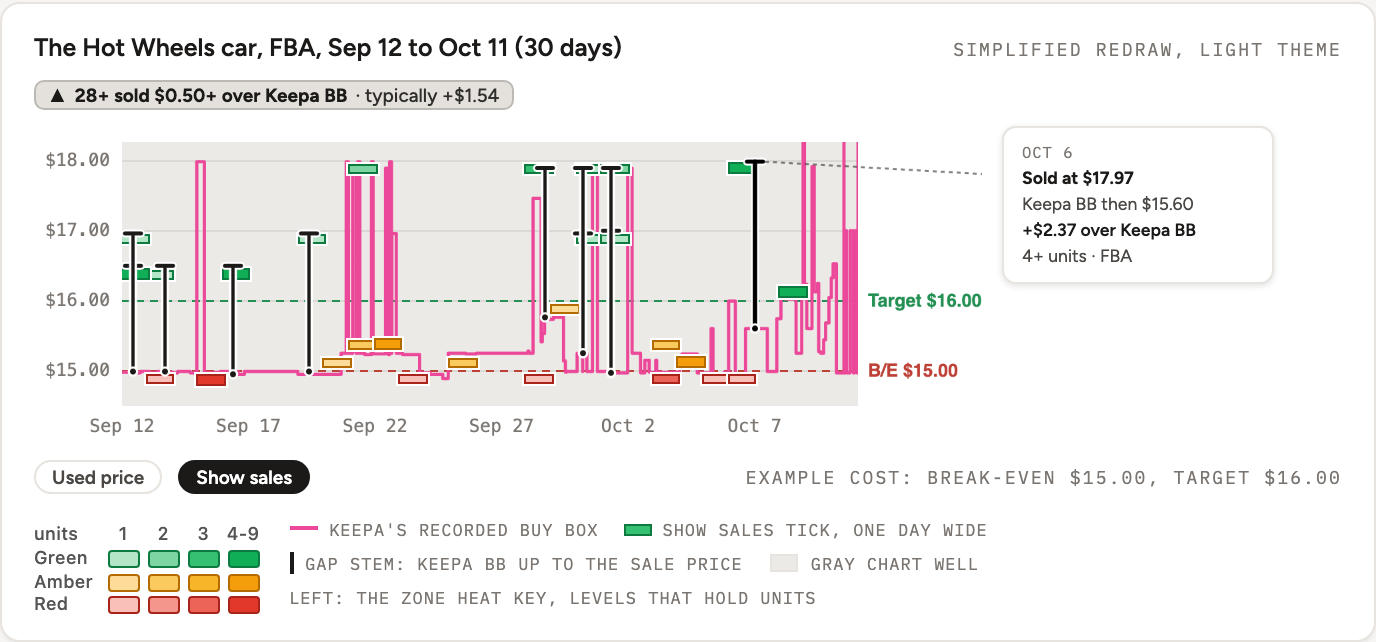
The classic Recorded Buy Box chart carries Sales DNA too, two ways. Show sales, an opt-in chip, puts a short tick at each price that moved units that day. Sold over Keepa Buy Box counts the units that sold at least your amount over Keepa's recorded Buy Box at that moment, and draws each group of them as a gap stem. On the Hot Wheels car, 28+ FBA units sold $0.50+ over Keepa's Buy Box in 30 days, and 76+ in 90 days. The amount is a setting, $0.25 by default.
- Show sales, in Zone Heat
- Opt-in, in the chip row under the chart: a tick at each price band that moved units, one day wide, for your sellers and range. It needs a cost. Ticks and field cells heat inside their own zone's hue, up to four levels from the listing's own quartiles; only levels that hold units are shown.
- The chip and the stems
- The chip carries the count, your amount and the typical gap. Each stem runs from Keepa's recorded Buy Box at that moment up to the sale price, one width for all; click the chip to hide or show them. Hover a stem for the date, the sale price, Keepa's Buy Box then, the gap and the units. Drag across the chart to zoom in.
- Always shown once read
- With nothing over your amount the chip still shows, muted ("0 sold $0.50+ over Keepa BB"), so it never reads as a failed load. On the Sales DNA view it is a label only.
- Your amount
- Settings, Sales DNA card: dollars ($0.25 by default) or percent of price (5%). Bulk starts from the same amount. Share as image prints the ticks and stems while they are on.
One regional view. Keepa's Buy Box is one regional view (the rear-view mirror): a sale over it may have matched a Buy Box shown somewhere else. A stem is units sold over what Keepa recorded at that moment, inferred and a floor. On the light theme the stems are dark ink on the gray chart well; the Sales DNA field stays white.
Bulk: finding them in a list
Bulk runs the same read on every ASIN in your list, about 600 an hour with no list cap: every seller's stock record, live and departed, priced at what each seller charged. Every row gets the same read as a product page. Each card carries the count, and a filter pulls the listings with evidence to the top.
The pattern is not rare so much as unlooked for: nobody reads every seller's stock record by hand. The scan does, on every row. Sales DNA comes with Premium, on every product page and in Bulk.
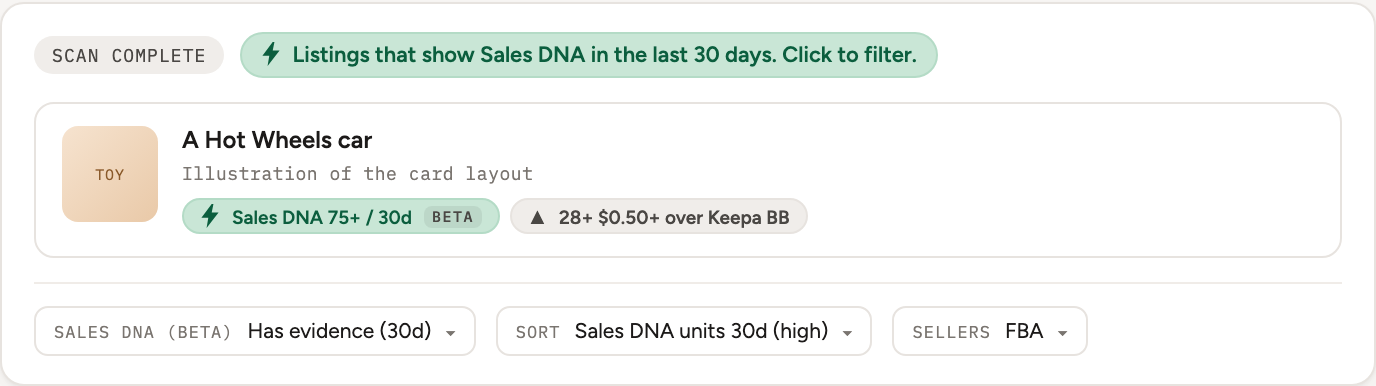
- Badge and completion line
- Each card carries the count for the sellers you chose: units and range, plus a Sold over Keepa Buy Box flag when it qualifies. When the scan finishes, one line says how many listings show Sales DNA in the last 30 days. Click it to filter to them.
- Sort
- Sales DNA units 30d, above break-even 30d or sold over Keepa Buy Box, high first. Listings whose inventory was not read sort last. Nothing else is held back: no floor, no labels.
The filter: Sales DNA (Beta)
| Option | Shows |
|---|---|
| Has evidence | At least one unit inferred moved in 30 days. |
| At or above break-even | Units at or over your break-even, 30 days. |
| None found | Inventory read; nothing moved in 30 days. |
| No FBA sellers | None of your channel in 30 days. |
| Not read | No seller inventory in Keepa yet. |
| Sold over Keepa Buy Box | N+ units at your amount over Keepa's Buy Box. |
| Velocity | At least N units in 30 or 90 days (velocity check). |
CSV export: thirteen columns
- Sales DNA Units 30d
- Sales DNA Units 90d
- Sales DNA Highest Price Moved 90d
- Sales DNA Units At/Above Break-Even 30d
- Sales DNA Sellers 90d
- Sales DNA Departed 90d
- Sales DNA Channel
- Sales DNA Status 30d
- Sales DNA Amazon Units From Sales Rank 30d
- Sales DNA Over Keepa BB Units
- Sales DNA Under Keepa BB Units
- Sales DNA No Keepa BB Units
- Sales DNA Over Threshold
Sales DNA as your velocity check
Step 1 of the 3-Step check, velocity, can read either source. In Settings, Velocity Check, the Velocity Source is Sales DNA or Amazon bought in past month. Amazon stays the default and works as before. Sales DNA reads units from sellers' stock records, for the channel set in its card: FBA by default. On the Hot Wheels car the velocity step reads 75+ FBA units in the last 30 days; Amazon's badge on the same listing says 100+ bought in past month.
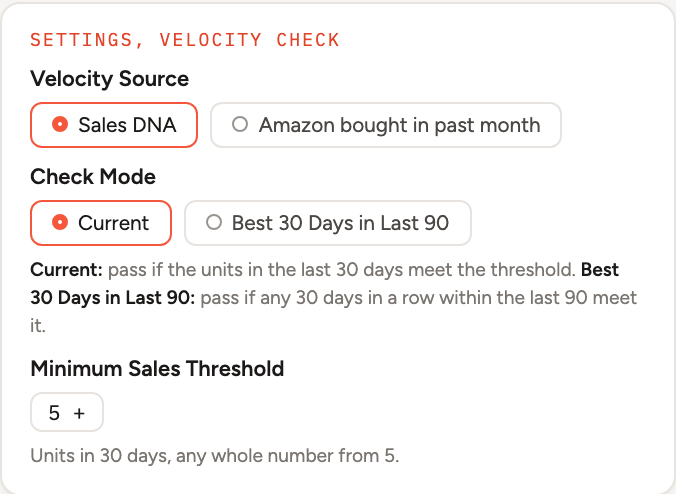
Two minimums, one control
Amazon's badge starts at 50, so its minimum does too, in Keepa's steps. Sales DNA counts whole units from 5. One control edits the source you picked; the other waits, so switching back restores it. A value under a source's floor is raised, and a line says so. The check is neutral at every threshold: the count, the window, the channel and your minimum, nothing else.
What the check shows
The pill reads "Sales DNA 75+/30d" in Current mode, or "Sales DNA 97+ best 30d" in Best 30 Days in Last 90. Its tooltip says, for example, "75+ units in the last 30 days by Sales DNA (FBA); your minimum is 5." The pill and the 3-Step tooltip read the chip's own 30-day count, a floor: 75+/30d here where Amazon's badge says 100+ (what Keepa's readings miss shows why a floor can sit well under the truth). With no readable seller log the step says "Sales DNA could not read sellers on this listing" and fails as a listing with no data does.
The share card. Share as image prints the Velocity tile from the same source as the pill: under Sales DNA, the pill's own number with the name beneath; under Amazon, the badge with "Amazon" beneath.
In Bulk. Step 1 follows the source on every row, read from the row's stored roll-up, with no extra tokens. Rows scanned before this version read "re-scan" for it. The Sales DNA filter adds Velocity: at least N units in the last 30 or 90 days, for your seller channel, prefilled from your Settings minimum.
What Keepa's readings miss
Sales DNA infers a sale from a fall between two of Keepa's stock readings for a seller. Keepa reads a seller's stock when it re-scans the listing, not all the time, so some real sales never show. There are three ways it happens.
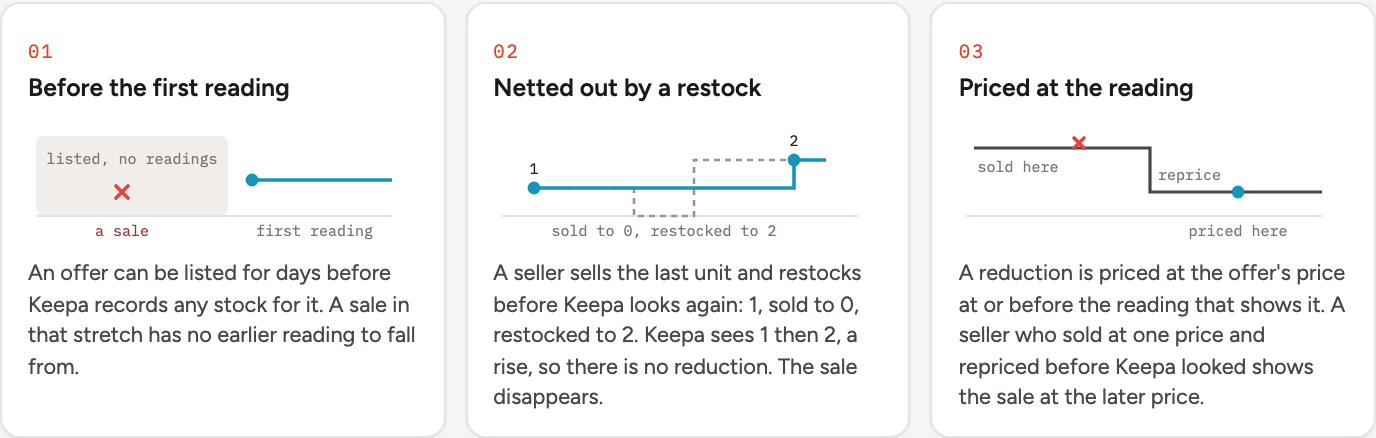
Six units sold. Keepa saw one of them.
Our own offer on a Hot Wheels car, May 25 to June 17, checked against Seller Central: 6 units, $102.93, all in June 2026. The offer was listed at $19.99 from May 25, with dips to $17.99 and $17.07. Keepa's first stock reading for it came on June 9.
| Date, 2026 | What happened | Keepa reading | Sales DNA |
|---|---|---|---|
| May 25 | Listed at $19.99 | none | Nothing to read yet |
| June 7 | 1 sold at $19.99 (Seller Central) | none | Missed: before the first reading |
| June 9 | Keepa's first stock reading | 1 | Starting level |
| June 14 | Restocked; price set to $16.61 | 2 | A rise, ignored |
| June 17 | Keepa's next reading | 1 | 1 moved at $16.61, inferred |
| All of June | 6 sold, $102.93 (Seller Central) | 1 seen; 5 never show as a reduction |
Why every count is a floor. The one unit Sales DNA sees is the June 17 reduction, priced at $16.61, the price set June 14: the "You" cell at $16.60 to $16.64 on the field. The June 7 sale came before Keepa's first reading. On a seller Keepa reads only a few times, the floor can be a small fraction of what really sold. That is why every count prints with a plus, and why an empty or thin field is never proof that nothing sold.
What it cannot tell you
Every instrument has edges. These are ours, stated plainly. This feature answers one question well: what moved on this listing, at what price, from which sellers, over the range you pick. The questions around it stay yours.
- Evidence, not proof
- An inventory reduction is units leaving a seller's shelf. Most are sales. Some are removals, transfers or corrections. That is why the words are "moved" and "inferred," and why every number is a floor.
- What the log can't see
- Keepa reads a seller's stock at intervals (what Keepa's readings miss). Sales before its first reading are invisible, a restock can net a sale out, and a reduction is priced at the reading. Our own June offer sold 6 units; Sales DNA sees 1. On the Hot Wheels car, 26 more FBA offers in the 90 days had no readable log.
- Your worst case is on the chart
- The lowest lit price in a column is the price you may have to match to get out. The highest is the price the evidence says is possible. Higher may be possible too. There is just no evidence for it yet.
- Demand, not profit
- Evidence of sales at a price doesn't mean it's an automatic buy for resale. Your zones, your fees and your cost still decide that, and the field shows the evidence against them so you can see it at a glance.
Getting started
- Open any listing. The Sales DNA chip on the chart switch carries the count for the sellers you chose. Enter a cost so your zones color the field.
- Read it against your zones. Switch to Sales DNA and expand it. Check the bright bands, how much moved at or over your target, and the ladder with its Buy Box counts. Open the sellers list if you want to know who.
- Then test it. Start where the evidence says units moved, not where the recorded Buy Box sits. Start small.
Profit Zones is not making up a price. Keepa already recorded the movement. Profit Zones reads it, shows its work, and leaves the call to you.
Source of truth. Every example number in this paper comes from the extension's own Sales DNA code as built for 1.6.0, read the way the panel reads it (whole UTC days), from Keepa data for a Hot Wheels car pulled 2026-10-11 02:10 UTC. The field is drawn by the extension's own painter. The example cost is illustrative. The June coverage example is our own offer, from our Seller Central. Live listings change by the hour, so reopening one today will show different numbers.
Free for a limited time. Get it while it's free. Sales DNA is part of Premium. Install Profit Zones now and it reads every listing you open. Once it goes Premium, free users get a locked preview.