Profit Zones · profitzones.app/research/buy-box-by-metro
Research · Buy Box by Metro Premium US only
Buy Box by Metro: one product, a different price in each city
A Buy Box price belongs to a product and a place. We priced the same products in up to 18 US metro markets at the same instant for four months. Here is what we found, how we measured it, and what the spread in Profit Zones means.
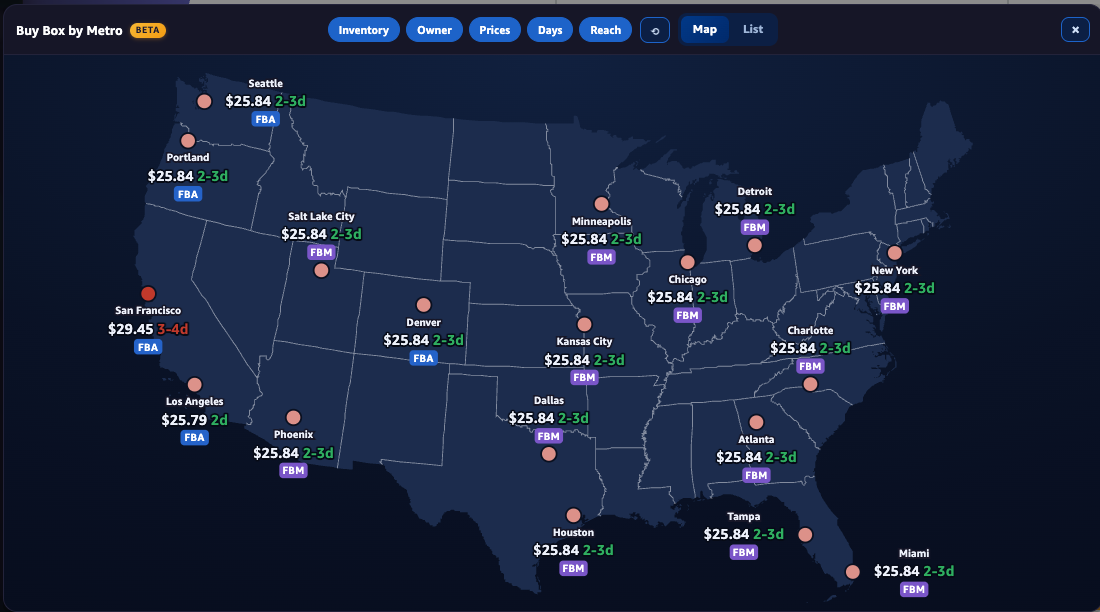
The short version. About 43% of the products we tracked carried a different Buy Box price depending on where the customer lives. When they did, 96.8% of the time more than one seller was holding a Buy Box somewhere in the country at the same moment: a median of three, as many as eleven. Nobody set those prices by region. Amazon gives sellers one price per listing, so the gap is a different seller winning in a different place. Keepa's Buy Box is one accurate reading from one place, and that place is on the East Coast.
- 43% of ASINs
- Varied in price by metro at least once: 12,423 of 28,664.
- 96.8%
- Of varying products had more than one Buy Box holder across the country at the same moment.
- 97.3%
- Of same-delivery-day price gaps were a different seller, not one seller charging two prices.
What Buy Box by Metro shows
Ask an Amazon seller how they price and you get one of two answers. "I match whatever Buy Box I see." Or "my repricer handles it." Both share an assumption so basic almost nobody examines it: that there is one Buy Box price. One number, one competitor, one market. We spent four months measuring whether that is true. It is not, and it is not close.
Buy Box by Metro is the part of Profit Zones Premium that shows the spread on the listing you have open. It works on amazon.com only, and the map is labeled Beta.
- Buy Box Spread
- On the panel, a bar from the lowest metro price (red) to the highest (green) with a median marker, and the spread in dollars and as a percent. When every metro agrees it says "price everywhere." When no metro returns a price it says "No metro data." When nobody holds a Buy Box it says so and shows the lowest offer instead.
- The list
- One row per metro: city, ZIP, its Buy Box price, the fastest delivery promise, and who holds it (Amazon, a third-party FBA seller or an FBM seller), with a cue when a metro looks open to other sellers.
- The map (Beta)
- A dot per metro colored by your Profit Zones at that metro's price once you enter a cost, plus toggles for your FBA inventory, the seller type, prices, delivery days and Reach: lanes from every fulfillment center you are stocked in to the metros it serves.
- Your stock on the map
- With Seller Central access turned on, your own FBA units show at the metros they sit nearest, including units in transit between fulfillment centers.
It reads up to 18 US metro markets per lookup: New York, Los Angeles, Houston, Chicago, Phoenix, Charlotte, Denver, Atlanta, Dallas, Seattle, Miami, Detroit, Minneapolis, Tampa, Portland, San Francisco, Kansas City and Salt Lake City. A real lookup can return fewer priced metros, and the widget says so rather than guessing. Lookups are metered, with daily and monthly limits.
Finding · The rotation
Why Buy Box prices differ by metro
It is common, and it is not noise
23,164 of 54,779 scans (42.3%) showed measurable price variation across markets. At the product level, 12,423 of 28,664 ASINs (43.3%) varied at least once. Turn that around: a repricer that chases one national Buy Box number is doing useful work on the 57% of products where one national number is real. On the other 43%, the number it is chasing is real in one place and irrelevant everywhere else.
You are competing with three sellers, not one
For every scan showing variation, we checked whether the same seller held a Buy Box in every market, or different ones. In 96.8% of cases more than one seller held one somewhere in the country at the same moment, on the same product. The median product had three different Buy Box holders across the 18 markets at once. The most we recorded on a single product was eleven. In 3.3% of cases Amazon itself held the box in some regions while a third-party seller held it in others.
When you price at a Buy Box you can see, you are pricing against one offer in one location and applying that price nationally. In 96.8% of varying products, whoever you just matched is not your competitor across most of the country.
Delivery speed explains about a third of it
Take the priciest and the cheapest market on each product at one instant and ask which one Amazon promises to deliver first. Speed decides who is in the race. Price decides who wins it.
The expensive market arrives first in 55.1% of cases. Rank every market in a scan by price and by promised arrival and the correlation runs the way you would hope: a median of −0.33, negative in 73.5% of scans. Weighted by dollars rather than by product count, the premium buys speed in 66.6% of the spread, so big gaps are more likely to be speed gaps than small ones are.
Then hold speed still. We grouped the markets inside each scan by identical promised delivery date and measured the spread that survives within a group: same product, same instant, same arrival day. In 66.2% of products that vary, the entire spread survives at an identical delivery date. What is left is usually small, around twenty cents, and occasionally enormous: the widest gap we recorded between two cities promised the same day was $171.16.
Nobody set those prices by region
Amazon does not offer regional pricing. A seller sets one price per listing and that price applies in all fifty states. So we checked all 26,926 cases where two markets shared a delivery date and disagreed on price, and asked whether the same seller name held both ends of the gap.
The 2.7% (715 cases) is not regional pricing either. Amazon itself is in 23.4% of them, and as the retailer it can vary its own price. 26.2% are merchant fulfilled, where the recorded figure is item price plus shipping, and shipping varies with distance. And 71.6% show exactly two prices across a median of five markets, the signature of a price change spreading across the country while our scan was in flight. These overlap, so they are not a clean split; the point is that nothing in the 2.7% needs anyone to have set a regional price.
Geographic price variance is not a pricing behavior. It is a rotation: the competitor underneath you changes as you move across the country, and the price changes because the competitor changed. Every seller involved set exactly one national price.
Regions are real, and they still do not tell you enough
99.9% of scans resolved to eight or fewer distinct prices across all 18 markets, and the markets that agree most are the clusters you would predict.
No pair agreed more than 82.2% of the time, and not one of the 153 pairs agreed above 99%. Charlotte and San Francisco agreed only 24.3% of the time. Inside a single delivery region, who holds a Buy Box still changes about one time in five.
Distance widens the gap but does not create it. Holding delivery speed constant, same-speed market pairs disagreed on price 20.3% of the time within a US Census region and 30.4% of the time across two regions (364,257 and 873,574 pairs), and the 90th-percentile gap widened from $0.16 to $0.41.
You cannot infer a region's Buy Box price from one ZIP code inside it. The likely tie-breakers within a region are fulfillment center placement (whose units sit closest to that ZIP), stock depth and seller performance; we measured that it happens, not exactly why.
Finding · The instrument
Where Keepa's Buy Box is read from
Keepa is the price memory of the Amazon seller economy, and its Buy Box line is treated as the price of a product. If a Buy Box price belongs to a product and a place, that one line has to come from somewhere. Keepa might blend prices across the country, report the cheapest anywhere, or simply be a shopper standing in one place. We compared Keepa's Buy Box history for 3,000 ASINs against our regional scans read at the same moment.
It is a real price, not an average
Keepa's number sits inside the observed range 95.3% of the time and lands exactly on a price some real city is paying 93.9% of the time. An average would routinely fall between the observed prices. It does so 1.9% of the time, about what rounding and our own timing slack would produce. Keepa is not calculating. It is looking.
It follows New York
Ranked by plain agreement, New York leads at 75.5% and San Francisco trails at 55.4%. To check that this is not chance, we shuffled which city held which price inside each scan two thousand times: no shuffle produced a leader as strong as New York (p < 0.0005).
Most of the time most cities share one price, a national default, and Keepa matches that default 72.7% of the time. So the real test is the moments a city breaks away from the default. When New York breaks away, Keepa follows New York 49.1% of the time and stays with the default 37.4% of the time. New York is the only one of the 19 cities in this window where Keepa follows the city more often than the default.
Why 19 cities and not 18: across this scan window, 19 distinct cities (19 ZIP codes) appear in the panel. Philadelphia is not one of the 18 metros Buy Box by Metro reads today. It was in the panel for only part of the window, a partial window, so it is charted here with the rest but treated with care below.
The order is longitude
That list is not alphabetical, not by population and not by market size. It is a map. The correlation between a city's longitude and how often Keepa follows it is 0.816 (t = 5.83, n = 19), and it still holds at 0.794 with Philadelphia dropped, the check we ran because Philadelphia's window was partial. The same test against latitude finds nothing (0.088). Keepa observes Amazon from the US East Coast: where the country agrees, that is simply the national price; where it splits, Keepa reports the eastern outcome, most sharply New York's.
This is not a knock on Keepa. Standing in one place is the only honest thing a price tracker can do, because Amazon never produces a national price. The mistake is reading a number that came from somewhere as a number that came from everywhere. If you sell into the West, Keepa's Buy Box is the reading your western customers are least likely to be seeing: San Francisco, Phoenix and Portland are the cities it tracks least.
How the measurements work
- 117 days
- 9 April to 4 August 2026.
- 54,779 scans
- Each one reading every market at the same instant.
- 28,664 ASINs
- Distinct products scanned.
- ~986,000
- Individual market prices recorded.
Each scan reads the anonymous Buy Box in each of 18 US metro markets: the offer a first-time, not-logged-in shopper in that ZIP code would see, with the winning offer's seller, fulfillment type and delivery promise. All 18 are sampled inside the same scan, so time is held constant and only location varies. Most price variance analysis is really measuring time and attributing it to geography; this does the opposite.
The delivery-speed work used 52,919 scans and 938,670 market prices, 94.6% of them carrying a delivery date. Every comparison is made within one scan, between markets sampled seconds apart, so the small time-zone ambiguity in a delivery date affects both sides equally.
The Keepa comparison used 3,000 ASINs and 11,800 scans from 26 May to 22 August 2026. Two filters removed data that would have flattered the result. Only points tagged as genuine Buy Box observations were kept, because Keepa's price series falls back to the lowest FBA price and then Amazon's own price when Buy Box history is thin. And any comparison where Keepa's price changed within three hours either side of our scan was dropped, which cost 3,447 of the 11,800 candidates. Of the 5,005 that survived, 1,765 carried location information; in the other 3,240 every market agreed, so Keepa matched all of them at once. Keepa history was read from cached extension data.
Why many markets, not a few
Eighteen metros is a sample, not a census of American ZIP codes. We tested how small the sample could get before it misled us, by evaluating every possible smaller subset. Fewer than ten markets systematically understates the spread. A six-market sample missed the spread entirely in 17% of cases, including one product where a $222 spread was invisible. That is why Buy Box by Metro reads up to 18.
Every figure is an aggregate count of products and prices. No account, seller or customer information is attached. The findings are stable: across the full 117 days, the share of scans showing variation moved by two percentage points and the median spread by five cents against a 30-day sample, and the most recent two days alone gave 97.1% against 97.3% on seller identity and 62.5% against 66.2% on spread surviving at identical speed. Every one of the 18 markets was the high or the low price in 83% to 86% of varying scans, so the variance is spread evenly across the country rather than concentrated in a few volatile markets.
What the spread means
The spread on a listing is the highest metro Buy Box price minus the lowest, among the metros that returned a price at that moment, shown in dollars and as a percent. It is a snapshot of one instant, not an average over time. A spread of zero ("price everywhere") means every priced metro agreed right then.
Half of the products that vary do so by less than a dollar, which is easy to read as noise. It is not. Seventy cents on a $25 product at 12% net margin is roughly a quarter of your profit on that unit. A quarter of varying products move by $1.96 or more, one in ten by $4.18 or more, and the largest single spread we recorded was $222.
A spread alert marks a listing with a green star when its spread reaches your threshold, $1.00 by default, set in Settings.
The spread tells you a gap exists and how wide it is. It does not tell you that you would win at the top price, how many units would sell there, or that the gap will still be there tomorrow: the ceiling on our example product moved $1.79 inside one day.
One product, worked through: a Hot Wheels car
In June 2026 we sold six units of a Hot Wheels car through FBA, unit cost $5.79, in six orders between 7 and 26 June. The fees were simple: a referral fee of 15.00% of the sale price and a flat $4.09 FBA fee at every price tested, so every extra dollar of price landed as about 85 cents of profit.
On 8 June at 18:10 one unit sold at $17.07 while Keepa's Buy Box that hour said $16.35. That looks like overpricing that got lucky. Our scan record for that day says otherwise: the highest regional Buy Box across the 18 metros was $18.11 that morning, $16.32 by late afternoon and $17.99 the next day. Across the month Keepa's Buy Box ran $15.20 to $16.61 while the regional ceiling ran $15.45 to $18.15. The sale was not priced above the market. It was priced to a different one.
| Sold | Price | Net | Keepa | Net at Keepa | Difference |
|---|---|---|---|---|---|
| 7 Jun 11:05 | $19.99 | $12.90 | $16.47 | $9.91 | +$2.99 |
| 8 Jun 18:10 | $17.07 | $10.42 | $16.35 | $9.81 | +$0.61 |
| 9 Jun 00:37 | $17.07 | $10.42 | $15.20 | $8.83 | +$1.59 |
| 14 Jun 14:51 | $16.61 | $10.03 | held it | $10.03 | none |
| 14 Jun 17:16 | $16.61 | $10.03 | $16.45 | $9.89 | +$0.14 |
| 26 Jun 07:37 | $15.58 | $9.15 | held it | $9.15 | none |
| Six units | $102.93 | $62.95 | $96.66 | $57.62 | +$5.33 |
- +$5.33
- On six units of one toy car: $28.21 profit against $22.88 at Keepa's Buy Box.
- +23% profit
- On +6.5% revenue, because the fees are mostly flat.
- +$2.34
- On the other five with the best trade ($19.99) left out: +12.5% profit, $0.47 a unit.
Hard records are the prices, timestamps and fees. Fulfillment center placement is read live and never retained, so the June record cannot be replayed sale by sale against where the units sat.
What this means for how you price
Everything above is measurement. What follows is reasoning from it: hypotheses to test against your own catalog, not guarantees.
- A visible Buy Box price is one number from one place. On a product with real volume the useful question is what it is where your inventory actually ships from and to.
- Stop looking for the seller who is charging your region more. There is no such seller, and there cannot be one. The price changed because the winner changed.
- A competitor's price only tells you about the regions they win. With a median of three holders per varying product, the one you can see may hold nothing where you sell.
- Inventory placement is a pricing input. Amazon serves each customer from the stock nearest them. One national price can still aim at the highest-paying region your stock can reach, sell through there, and step down to the next region as it clears. Losing the cheaper markets on the way is the point, not the cost.
- Rank by what a gap is worth. Acting on a spread means pricing by hand where a repricer would otherwise do it, so rank on spread times units sold, not on spread alone. Seventy cents on a product moving five hundred units a month is worth more of your attention than four dollars on one that sells three. On the 57% that do not vary, a conventional repricer already works.
Limits
- Beta, and US only
- Buy Box by Metro reads amazon.com only. The map is Beta, and how fulfillment centers are attributed to metros is still being refined.
- The anonymous Buy Box
- We read what a not-logged-in shopper sees, which can differ from what a logged-in shopper with purchase history sees.
- Winners, not losers
- We record the offer that won each market, not the offers it beat, so we cannot say whether the fastest offer in a ZIP won it.
- A sample of the country
- Up to 18 metros, not every ZIP code. A single flat scan is not proof of a flat product.
- Small typical gaps
- The median surviving same-day gap is about twenty cents. The case for acting rests on the tail, where gaps run to several dollars and beyond.
- No return figure
- We have not proven that acting on the spread makes a specific amount of money. One worked product is evidence, not a promise about your catalog.
- Keepa's location
- We infer an East Coast region, not an address. New York is followed 49% of the time, not 100%. Keepa samples irregularly and more often on popular products. Scans before 26 May used seven ZIP codes that returned unrepresentative data and are excluded.
- Metered lookups
- Each lookup counts against a daily and monthly allowance. A lookup can return fewer than 18 priced metros, and the widget says so.
See the spread on your own listings. Buy Box by Metro is part of Profit Zones Premium, on amazon.com. The rest of this paper holds whether you have it or not.